Telemetry Monitoring
A quick summary of Telemetry Monitoring
Telemetry and Monitoring support
The Patras5G facility in University of Patras, provides remote access to it’s monitoring infrastructure via a VPN to all involved partners. Currently the infrastructure provides monitoring data and metrics related to the Cloud infrastructure, for all the VNFs and all the RAN nodes via NetData while all data are gathered in a Prometheus server.
A Prometheus as a service within a slice is also available

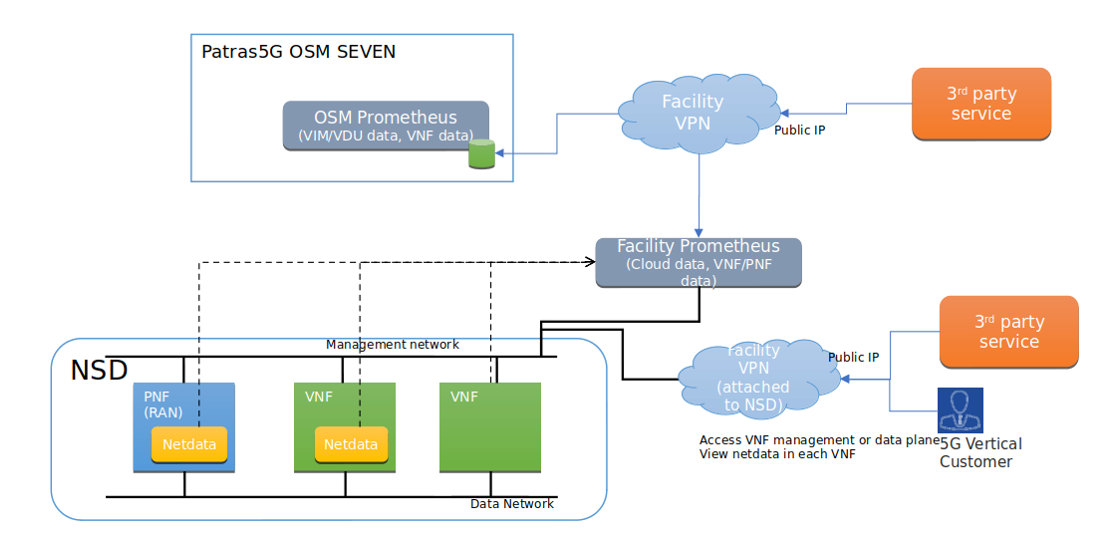
This architecture collects monitoring data directly from the VNF’s and PNF’s. Another instance of PROMETHEUS will be provisioned inside the cloud, that will establish a new channel of communication between the VNF’s which will be used only for monitoring and management purposes. Over this network PROMETHEUS will collect data from the VNF’s that will contain and run an instance of NETDATA software. NETDATA will provide a REST API that will be accessible from the management network [1]. NETDATA will also collect data from RAN via a custom plugin that UoP will develop. This information will be used to evaluate KPI’s and will provide information about:
• Node health
• Number of UE’s connected
• UE signal strength
• Aggregated node traffic (Downstream / Upstream)
• Traffic per UE connected (Downstream / Upstream)
UE’s will be categorized by IMEI and IP address

The Vertical Customer/Application will connect via VPN to PROMETHEUS and communicate via HTTP REST API [2] to collect the data. Historical data will be also stored in PROMETHEUS TSDB database and will be accessible via the API.
In the future PROMETHEUS and VPN software will be incorporated into the cloud and described in an NSD as a VNF as seen in the figure below. This NSD will take care of running the service and monitoring VNF’s, and configuring the network between them. A new instance of PROMETHEUS and VPN will be used on every experiment
Patras5G facility monitoring in NSD:
